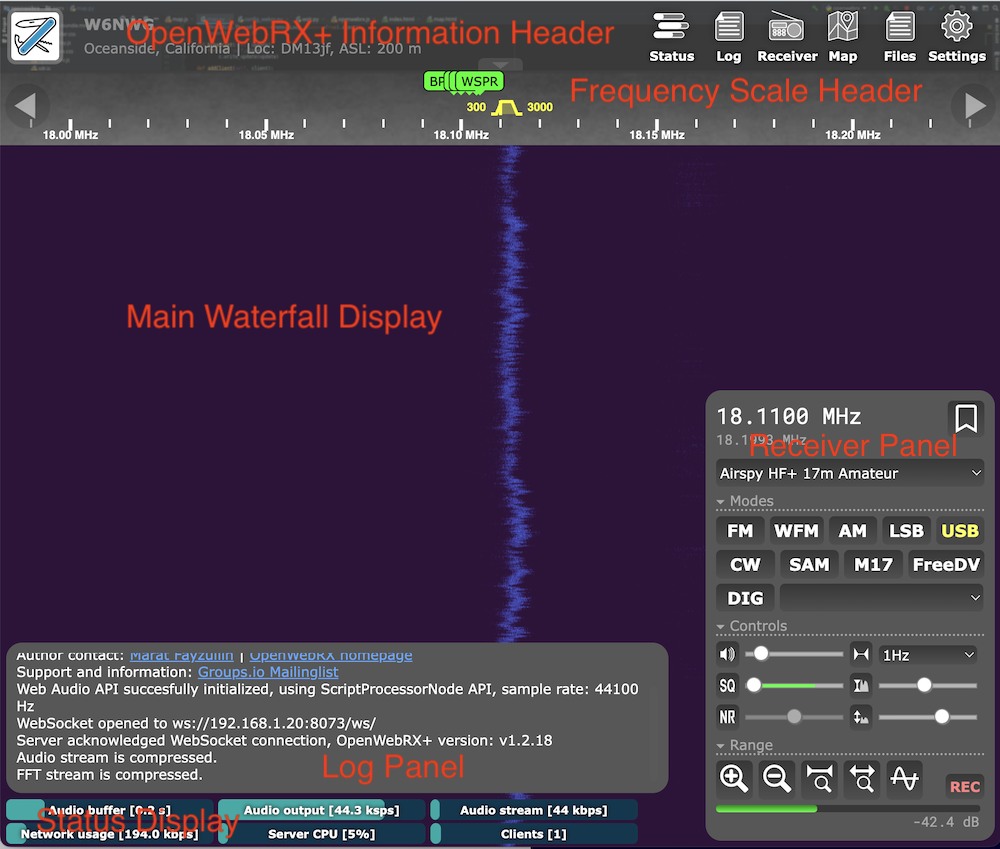
The OpenWebRX+ Main Waterfall Display
OpenWebRX+ Waterfall Display

The waterfall itself is pretty typical of waterfall spectrum displays.
It has menus for selection of the SDR and band, audio and digital decoding modes, waterfall display colors and more.
The currently selected frequency is displayed on the Frequency Scale Header at the top.
Various status indicators are arrayed along the bottom; above them is a Log Panel for text messages concerning the status of the connection, server, etc.
The main control sets are on the Receiver Panel. There are sliders for audio output level, squelch, waterfall zoom, etc.
| Information and Control Panels | ||
|---|---|---|
| Information Header | Has information about the station including its callsign and location. | Along the top right are menu buttons to show/hide various panels:
Status → Status Panel Log → Log Panel Receiver → Receiver Panel Map → Map page Settings → Settings Page |
| Frequency Scale Header | Displays a frequency scale for the waterfall display. The selected frequency is denoted with a trapezoidal frequency icon: |
The frequency icon indicates the currently selected frequency. Its width indicates the bandwidth corresponding to the selected Mode. ⓘ Frequency Tuning Details |
| Main Waterfall Display | Displays a colored waterfall depicting the signals across the band over time. | Display colors can be adjusted to better show weak signals. |
| Receiver Panel | Has most of the controls for selection of SDRs/bands, modulation and waterfall display. | ⓘ Receiver Panel Details |
| Log Panel | Shows some information messages. | Author, OpenWebRX+ support URL, connection status, errors encountered, etc. |
| Status Display | Displays server status and connection statistics. | Audio buffer depth and kbps, network bandwidth, server CPU load and number of connected clients. |
